Part A - Objective: For this assignment you need to create a function (sine wave) generator where you can change the amplitude, noise level, and frequency. You can use the examples we discussed in class to generate a sine wave.
- Then, turn your VI into a SubVI.
- Using the SubVI create a new module that generates TWO independent sine waves such that the user can change the amplitude, noise, and frequency of each signal separately.
- Plot the two signals on the same graph.
- Your new VI must have an ON/OFF switch to disable either signal.
- All results for both signals must be recorded in a file.
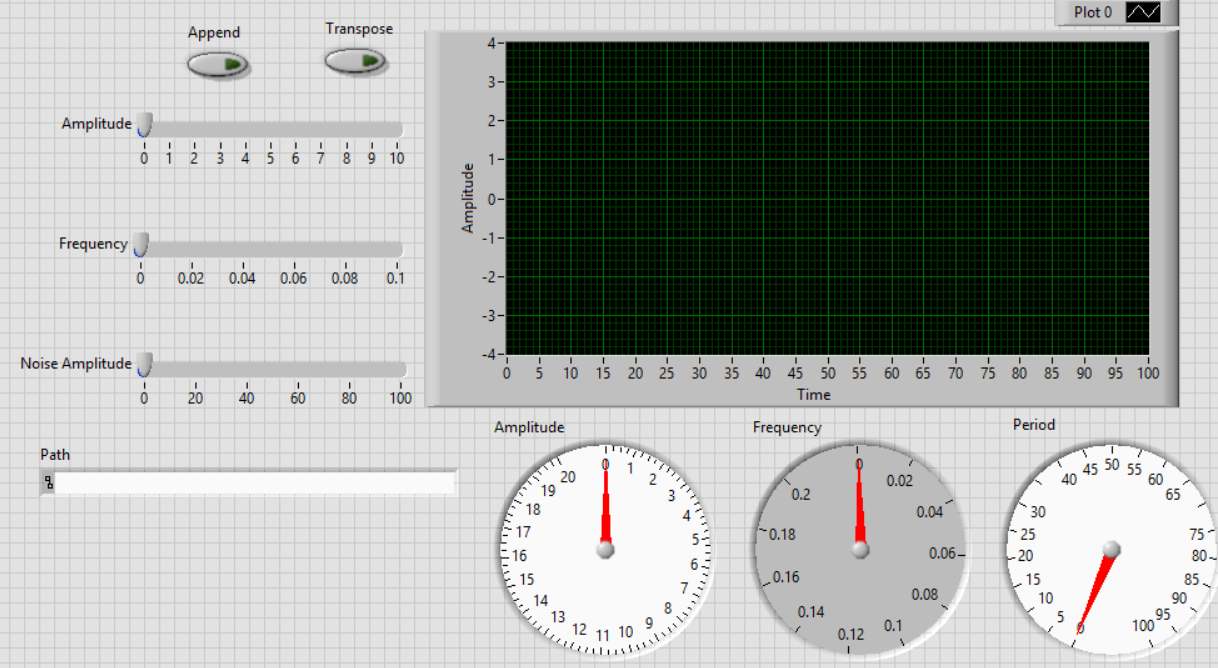
- Your GUI must also have a graph showing both signals (similar to what is shown below - click to open)
- Use Excel and show the generated results are correct.
Part B -Objective: (Graduate Students Only) Graph a function y = Ax2+Bx+C, where A, B, and C are three dials, each with range from -5 to 10. Use Waveform Graph to graph y for x = 0 to 10. Make sure you submit both assignments as a single project with an extension of proj.llb.
Part A - Objective: In this project you are simulating a weather station monitoring system.
- Create a SubVI to generate a array of weather data having temperature (F), pressure ( inHg), light (Lux), windspeed (mph), and relative humidity (%). The data could have the following format: 72,30,500, etc. The generated array can be random data or such that the user can change the data manually. Assume the values are generated every 5 seconds (the sampling time can be set by the user).
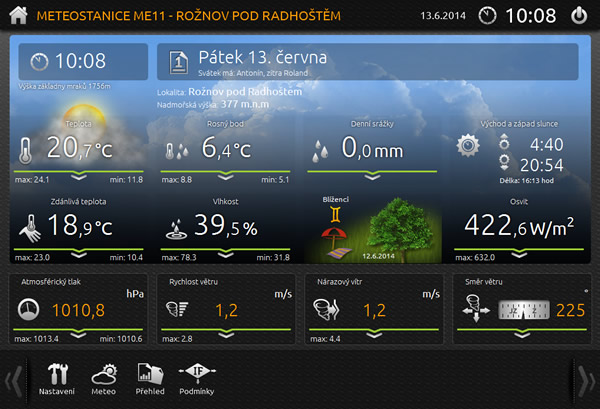
- Create another VI that uses the generated data from your SubV, then it parses them, and then it displays them in a very nice and organized fashion. On your Front Panel plot temp and relative humidity. All received data must be recorded in a file and time stamped.
- Grading: 50 percent is only for good comments, description, & good look (coloring, organization, etc.). See this example. Spend some time and search for better examples. The best design will receive a GIFT! Project your design on a big screen and see how it looks!
Part B -Objective: Make sure you can program your Arduino.
- Connect a potentiometer and an on/off switch to your Arduino.
- Write a sketch to read the potentiometer value and generate a value between -50 to 100 with exactly TWO decimal places. Your sketch should also read the switch and display a random number between 0-10 with exactly TWO decimal places.
- The results should be displayed on the terminal every X seconds in the following format: 1,X,-23.21,3.54 2, X,87.00, 5,21 etc.
- OPTIONAL: The user should be able to change the sampling rate (X in seconds) by sending a message from the terminal: X=5. Note that in this case we will have: 1,5,-23.21,3.54 2, 5,87.00, 5,21 etc.
------------------------ Assignment 4 ------------------------
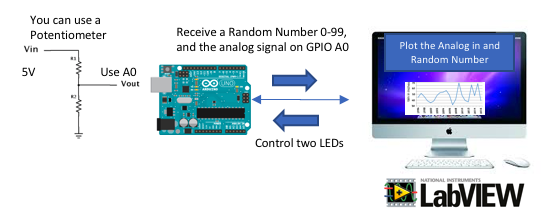
Part A - Objective: In this project you are interfacing LabVIEWwith an Arduino using the serial Interface.
- Using the Arduino sketch you did before generate TWO random integer values between 10-99 separated by comma: 10,23 34, 65 etc. You can also use a potentiometer connected to pin A0 to generate your integer values if you wish to do so.
- Write a LabVIEW program to receive the data, plot the two integer values on the same graph.
- Timestamp each received value and save it in a file.
- Your LabVIEW program should be able to turn on/off at least one LEDs on the Arduino (use pin 13 to avoid additional hardware).
- Run your system for at least 10 minutes and save the results. Are there any errors? Plot the results using excel.
- Use Bluetooth to interface if possible (optional)
- Submit your Arduino and LabVIEW codes & 10 min of captured resutls, including the excel plot. Codes with no comments do not receive grade.
Part B -Objective: Get LabVIEW to work with your sound card (graduate students only) - Each graduate student can pick one part:
- Generate an Audio signal using labVIEW & sound card in your computer. Your front panel should control frequency, amplitude, and waveform. Here is an example
- Design a VI to read audio files from the sound card and save it- Your front panel should do the following: measure the amplitude and frequency, plot the waveform in time anf freqnecy. here is an example
- Design a VI that compares two audio file and tell you how similar they are with each other.
------------------------ Assignment 5 ------------------------
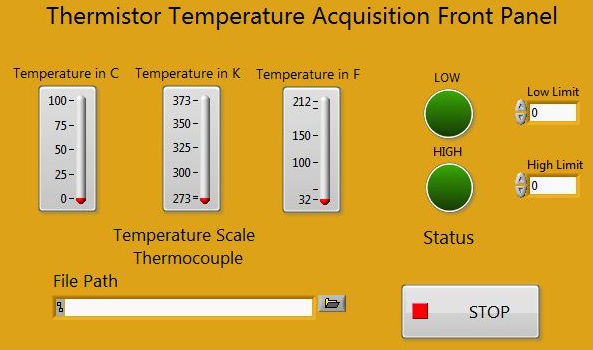
Part A - Objective: Use a DAQ to measure the temperature. Read the DAQ lab. Submit your report and your LabVIEW code.
------------------------ Assignment 6 ------------------------
Part A - Objective: Complete the structure and show it to your instructor.
Part B -Objective: Complete the structure and show it to your instructor. Follow the video. Submit the LabVIEW code and the structure.